Thursday, October 23, 2014

Biodiversity


Author: Tricia Edgar
What’s going on in your garden? Study different areas of your backyard to see which is the most diverse.

Problem:

Compare the biodiversity in a square of lawn, forest, and home garden. Which one has the largest variety of plants and animals?

Materials:

  • 4 1-foot long pieces of 1"x2" wood
  • Four nails
  • Hammer
  • Clothespin
  • Safety goggles
  • Margarine container or other small plastic container
  • Plant identification book
  • Insect identification book
  • Notebook and pencil

Procedure:

Can you see biodiversity? In this experiment, you’ll make a square and see if you can determine what areas have the most plant and animal diversity.
1.    First, get your nails, hammer, and wood. Find an adult to help you if you need it. Arrange the pieces of wood in a square with the edges overlapping.  Place a nail in each corner to attach the wood together. This is your biodiversity square.
2.    Now, choose three different sites: a garden, a forest (or other wild place) and a piece of lawn.
3.    Create a hypothesis, your best guess about what is going to happen. Which environment will present the most biodiversity: the garden, the wild place, or the lawn? Why?
4.    To keep things random, stand in the middle of each site and throw the clothespin into the air. Wherever it lands will be the middle of the place you will study.
5.    Place your square in the first environment. Take a close look at the environment. What plants are living there? If you can’t identify them, look them up in your plant book. What animals are living there? Generally, these will be tiny animals such as insects. Look them up in your insect book. Can you see evidence of other animals, such as tracks, bite marks, or scat (animal poo)?  Write all of your observations down in your notebook.
6.    Do the same thing in each of the three environments. Which one has the highest number of different sorts of animals? Which one has the highest diversity of plants? Why?
Results: Depending on the particular square you choose, the forest or garden environment will have the most biodiversity.

Why?

What did you see in your square?
Lawn environments are mostly grass, although they may contain a weed or two. They are not very diverse environments.
Garden environments are as diverse as people make them, and part of what you’ll see will depend on where your clothespin landed. If it landed on a densely-planted area, you may have found the most diversity in this square, especially if that square included a plant that attracts many useful insects.
One of the challenges of this experiment is accurately gauging an area’s biodiversity. This can be hard, because it can be difficult to identify all of the different plants and animals that are in your square. It can also be hard because it’s difficult to decide how deep you should search! Biodiversity occurs at all levels, from huge trees to microscopic creatures in the soil. It’s likely that the forest or natural environment has the most biodiversity, but proving this would require a microscope. Forests and other natural environments have a large amount of microscopic fungi, invertebrates, and soil bacteria that help keep the underground ecosystem running.
To do this experiment well, you’d repeat it over and over until you got a lot of information from many different squares. This would allow you to more completely understand the diverse plants and animals in each area. Go back to each place you studied and do the experiment a few more times. How did this influence your results?

Project: the antioxidant mistery.

http://www.odec.ca/projects/2006/haki6a2/

Conducting Reference Toxicity Tests with Lettuce Seeds

http://ei.cornell.edu/toxicology/bioassays/lettuce/default.html

The idea behind a reference toxicity test is that the test organism, in this case lettuce seeds, will respond in a predictable manner to varying concentrations of a particular chemical compound. At some threshold concentration, all of the test organisms will be killed (or in this case, none of the lettuce seeds will sprout). In solutions that are more dilute, some level of inhibition will occur in seed germination and/or radicle length. If the concentration is low enough, no response will be detectable.
This is called a dose/response experiment. You vary the dose of a selected compound, then measure the response of the bioassay organism.
Using NaCl
In order to determine whether lettuce seeds provide a good bioassay for salt toxicity, you can conduct a reference test using known concentrations of NaCl (table salt).
First, make a 0.2M NaCl solution by mixing 11.69 g NaCl with enough deionized water to make 1 liter.
Second, label a series of beakers with the following concentrations: 0.2M, 0.1M, 0.075M, 0.05M, and 0.025M. Make up these concentrations from the 0.02M solution using the proportions listed in the following table:
 
  Concentration
  0.2 M NaCl (mL)
  Deionized Water (mL)
 0.2 M NaCl
 100.0
 0
 0.1 M NaCl
 50.0
 50.0
 0.075 M NaCl
 37.5
 62.5
 0.050 M NaCl
 25.0
 75.0
 0.025 M NaCl
 12.5
 87.5
 Control
 0
 100.0
1. Treat the lettuce seeds in a 10% bleach solution for 20 minutes, then rinse five times with deionized or distilled water. This kills fungal spores that can interfere with seed germination. Note: Tap water can be used if you do not have access to deionized or distilled water, but it will introduce more variability into your experiment because of the varied minerals and other compounds it contains.
2. In each of 18 9-cm petri dishes, place a 7.5-cm paper filter. Label the dishes according to the first column in the following table. Note: Absorbent paper towels or coffee filters can be substituted for the filter paper, as long as they are first shown to be be nontoxic. (Bleached paper may contain dyes or chlorine.)
3. To each petri dish, add 2 ml of the appropriate test solution. In the control dishes, use deionized water as your test solution.
4. To each dish, add 5 lettuce seeds, spaced evenly on the filter paper so that they do not touch each other or the sides of the dish.
5. Place the dishes in a plastic bag and seal it to retain moisture. Incubate the seeds in the dark at constant temperature (preferably 24.5 degrees C) for 5 days (120 hours).
6. At the end of this time, count how many seeds in each dish have germinated, and measure the root length of each to the nearest mm. Look carefully at the plants to make sure you are measuring just the root, not the shoot as well.
Using Other Compounds
To be useful, a bioassay must be sensitive to the types of compound you are interested in evaluating. For example, if you are worried about herbicide contamination of ponds or streams, a bioassay based on seed germination might prove to be more sensitive than one based on death of fish or invertebrates. On the other hand, fish are likely to be much more sensitive than seeds to a compound that is a nerve toxin, for example.
To determine the sensitivity of an organism to a chemical compound, scientists carry out reference toxicity tests. To do this, you measure the response of the organism to a wide range of concentrations of the selected chemical. What concentrations should you use? That of course depends on both the bioassay organism and the chemical being tested. You might want to start by searching through published student reports included on this web site to see whether anyone else has already generated data that would be of use to you.
Before scientists begin an experiment, usually they search through published scientific literature for papers that relate to the procedure they have in mind. If you have access to scientific journals, it would be a good idea to look for papers that report bioassays using the organism and compound you are interested in (see References for example papers). This is a good way to get an idea about an appropriate range of concentrations.
If you can't find any appropriate data, that's ok -- you'll just have to start with a broader range of concentrations to make sure you hit the range that your test organism responds to. (With too high a concentration, the test organisms will all die, or in the case of seeds, none will sprout. With too low a concentration, you will not be able to detect any difference between your samples and your control.) Ideally, you want to test concentrations that cover both of these endpoints plus a range of concentrations in between. Then you will be able to conclude whether your test organism responds in a predictable way to the compound you are testing.
Serial dilutions are one way to set up a broad range of concentrations. For example, suppose you suspect that in a 100 mg/L solution of a selected compound, no lettuce seeds will sprout, and you are interested in narrowing this down to find out the range of concentrations in which germination will occur. You might decide to start with a 10-fold dilution series, testing solutions of 100, 10, 1, 0.1 and 0.01 mg/L. Another possibilitity would be a dilution series in which each solution is half the strength of the previous solution in the series: 100, 50, 25, 12.5, and 6.25 mg/L.
Once you have collected data using an initial set of concentrations, you may find that it would be useful to carry out a follow-up experiment using a more narrow set of concentrations. For example, if none of the seeds sprout at one concentration in your series, and all of them sprout at the next level of dilution, it would make sense to carry out a dilution series between these two concentrations in order to further define the sensitivity of lettuce seeds to your selected compound.


Taking Measurements
At the end of the 5-day growth period, count and record how many seeds in each dish have germinated.
For each sprout, measure the radicle length to the nearest mm. (The radicle is the embryonic root).
Look carefully at the plants to make sure you are measuring just the radicle, not the shoot as well. For example, in the picture below, you would measure just the part between the two arrows, not the shoot and cotelydons to the left.
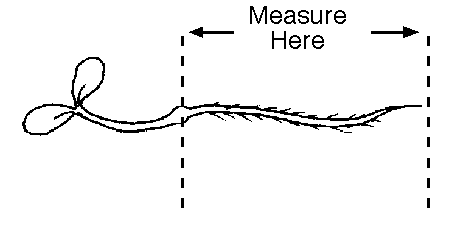
Measuring the lettuce seedling radicle image
 
How Good are Your Data?
Once you have counted how many seeds germinated, and measured their radicle lengths, then what? How can you interpret these results?
Comparison to the Control
The first thing to check is your control (the dishes that contain deionized or distilled water rather than a sample). The purpose of the control is to identify how well the seeds will grow without any added contaminants. Would you expect all of the seeds in your control dishes to germinate? Probably not, just like a gardener does not expect all the seeds in a garden to sprout.
If fewer than 80% of the seeds in your control dishes sprouted, something may have gone wrong in your experiment. Perhaps the seeds were too old or stored improperly, so they were no longer viable. Or maybe something went wrong with the conditions for growth. Did the dishes get too hot, too dry, or contaminated in some way? Did you use tap water for your control, rather than deionized or distilled water? In many cases this works fine, but since tap water is highly variable from source to source, it gives less predictable results.
A Look at Variability
Within each treatment, how much variability did you find in your results? Did the replicate dishes show similar numbers of seeds sprouting, and similar average radicle lengths? If you think the data are much more variable than you would expect, you might want to explore the potential sources of variability for this type of experiment.

Sunday, October 19, 2014

FERTILIZERS

 http://www.sciencebuddies.org/science-fair-projects/project_ideas/EnvSci_p017.shtml

Abstract

Did you know that when you use fertilizer in your garden, it can eventually reach a lake, stream, or pond? There are many different chemicals present in fertilizers. How will they affect the aquatic organisms in the ecosystem? In this science project you will get to find out!

Objective

Test the effects of liquid fertilizer on an aquatic environment containing small aquatic animals and plants.

Introduction

Fertilizers are chemicals that are added to the soil to increase the growth of plants in yards, gardens, or large agricultural facilities. The effect on crops can be increased growth, but fertilizers can have a negative impact on surrounding organisms in the soil.
When a heavily fertilized field is irrigated, excess water can flow along the surface of the land and pick up the fertilizers. This is known as surface runoff. The fertilizer-rich surface runoff can directly flow into nearby streams, lakes, or ponds, like the one shown in Figure 1, below. Additionally, chemicals present in the fertilizer can also infiltrate the ground water system and contaminate it. This polluted ground water can also make its way into nearby ponds, streams, or lakes. What happens to the aquatic organisms that are present in the environment when chemical fertilizers are present? How do the fertilizers affect the organisms' ecosystem?
A pond
Figure 1. How are the organisms in aquatic environments, like this pond shown here, affected by the chemicals from fertilizers?
In this science project you will test the effect of liquid fertilizer on an aquatic environment. Each aquatic environment will be a mixture of small aquatic plants and animals. By adding different brands of fertilizer, you can test how they affect the environment. Which fertilizers are the best choice for the environment?

Terms and Concepts

  • Fertilizers
  • Surface runoff
  • Ground water
  • Contamination
  • Ground water pollution
  • Ecosystem

Questions

  • How will fertilizer affect an aquatic environment?
  • Will all of the organisms be affected similarly or differently?
  • Which brand(s) of fertilizer will cause an effect?
  • Are organic fertilizers less toxic to aquatic ecosystems? 

Materials and Equipment 

100 mL graduated cylinder. Alternatively, a metric measuring cup may be used.
  • pH test strips
  • Small aquatic animals, such as small pond snails. 
  • Small aquatic plants, such as duckweed or Elodea (at least 40 if you are using smaller plants, like duckweed, or at least 12 if you are using larger plants, like Elodea). Pick one or two different types. Alternatively, these may be available from aquarium supply stores, ponds, or plant nurseries.
You will also need to gather these items:
  • Large, sealable, reusable plastic containers with lids, e.g., Glad or Zip-lock (4). These should each hold at least 1400 mL, or about 6 cups.
  • Permanent marker for labeling
  • Distilled water (2 gal.). This is available in most grocery stores.
  • Different brands of liquid fertilizer (3). You can find these at plant nurseries, the plant section of a hardware store. These may also be called "plant food," but you will want to confirm with a sales person at the store that these are also considered fertilizers.
  • Lab notebook

Experimental Procedure

  1. Rinse each container thoroughly with water. Do not use soap because it can coat the plastic container and may be harmful to the organisms in your experiment.
  2. Assign a number (from 1 to 3) to each fertilizer you use. Use a permanent marker to label the fertilizers' bottles, or just write the numbers you assigned in your lab notebook.
  3. Label each container "1," "2," or "3" with a permanent marker. Also label one container "Control."
  4. In your lab notebook, make a data table like Table 1, to record your data in.
  5. Use a graduated cylinder or metric measuring cup to prepare the solutions for each container according to Table 1. Prepare one container for each fertilizer, making sure the numbers on the containers match the ones you assigned to the fertilizers. In the container you labeled "Control," only fill it with distilled water, but no fertilizer, since it is your positive control. Use bottled distilled water, not tap water, because tap water may contain chemicals, like chlorine or chloramine, harmful to aquatic life.
Fertilizer Number Amount of Water
(mL)
Amount of Fertilizer
(mL)
Total Volume
(mL)
pH Observations
1 975 mL 25 mL 1000 mL    
2 975 mL 25 mL 1000 mL    
3 975 mL 25 mL 1000 mL    
Control (distilled water only) 1000 mL 0 mL 1000 mL    
Table 1. Prepare your containers based on this data table. You will want to prepare one container for each experimental fertilizer group, and one container that only has distilled water in it (and no fertilizer) for your control. The amounts of water and fertilizer needed are given in milliliters (mL).
  1. Check the pH of each container with your pH test strips and record the data in your data table. Also record any observations about the fertilizer or container you put it in.
  2. Evenly distribute the aquatic animals into each container, putting at least 5 into each container. If you are using more than one type of animal, make sure there is the same number of each animal type in each container.
    1. If you are using Daphnia, you can use a watering pipet or medicine dropper to move them from one container to another.
  3. Put 3 to 10 plants into each container, depending on the size of the plant.
    1. For example, if you are using small duckweed plants, 10 is a good amount, while if you are using the larger Elodea plants, 3 plants in each container is a better amount.
    2. If you are using duckweed, make sure that each plant has a stem (the part sticking down).
    3. If you are using large Elodea plants, you can carefully cut them into smaller pieces, about one or two inches long, so it is easier to count their leaves.
  4. In your lab notebook, make data tables like Table 2 and Table 3. In Table 2, write down the total number of animals in each container. In Table 3, write down the total number of plant leaves in each container.
    1. Note: If you are using more than one type of animal or plant, you can make another data table like Table 2 or Table 3 and separately record each type of animal or plant in its own data table.
  5. Each day, for five days, write down your observations in your data tables. Specifically, count and write down the total number of animals that are alive in each container, and the total number of plant leaves in each container.
Fertilizer Number Number of Animals Living
Day 1 Day 2 Day 3 Day 4 Day 5
1          
2          
3          
Control (distilled water only)                                              
Table 2. Each day, write down the total number of animals alive in each container. Note: If you are using more than one type of animal, you can make a second data table like this one and record each type of animal in their own data table. Put the name of the animal type in the title of the data table.

Fertilizer Number Number of Leaves on Plants
Day 1 Day 2 Day 3 Day 4 Day 5
1          
2          
3          
Control (distilled water only)          
Table 3. Each day, write down the total number of leaves in each container. Note: If you are using more than one type of plant, you can make a second data table like this one and record each type of plant in their own data table. Be sure to correctly title the data tables.
  1. Graph your results.
    1. You can make line graphs by hand or on a computer using a program like Create a Graph and then print the graphs out.
    2. Make one line graph that shows the number of animals living in each container over time. On the horizontal axis (x-axis) put the time (in days). On the vertical axis (y-axis) put the number of animals living. Make a line for each container you tested, including the control.
      1. Note: If you tested more than one type of animal, you can make a separate graph for each animal type.
    3. Make one line graph that shows the number of plant leaves in each container over time. On the x-axis put the time and on the y-axis put the number of plant leaves. Make a line for each container you tested, including the control.
      1. Note: If you tested more than one type of plant, you can make a separate graph for each plant type.
  2. Analyze your results and see if you can draw conclusions about how the different fertilizers affected the animals and plants.
    1. Did one type of fertilizer affect the animals more than another type of fertilizer? What about the plants?
    2. Did the animals and plants respond similarly or differently to the fertilizers?
    3. Overall, which seemed to be the least toxic? Which seemed to be the most toxic?

Sustainable Gardening This one is for you, Pepe !

Leaf Rubbings

Plants For Kids

Bringing the science of plants to the classroom

 This fun exercise is a simple and quick method that allows children to view the details within a leaf. Often only children only view leaves as the green things on plants connected through a stem. This exercise will allow them to see the many important parts of a leaf.

These are the supplies needed to see the structures of a leaf
leaf materials
-Crayons -Thin paper -Leaves

Methods:

Takes the paper wrapper off the crayons you will be using and go outside and find a tree that has leaves that you like. Search under the tree for fallen leaves that are still soft, if you cannot find any to gently break one off of the tree. On a flat hard surface, place the leaf in the position you wish to capture, and then place the paper over the leaf.

leaf sandwich


Holding the paper with one hand, rub the long side of the crayon over the leaf until you have a perfect copy of your leave on the piece of paper.
leaf blue
You can now see many of the veins that run throughout the length of the leaf. You might even be able to see the stem of your leaf. Be sure to use different leaves and colors so that you can compare the leaves of several plants and see how they are all very different. Below you can see our main leaf with two smaller leaves surrounding it.
leaf final 

http://herbarium.desu.edu/pfk/page29/page30/page31/page31.html

Water transport

Plants For Kids

Bringing the science of plants to the classroom


The following experiment is a fun and easy way to see how water and nutrients travel up the stem using xylem within the plant

These are the materials needed to view xylem in action:

- 2 liter bottle - 2 plastic cups - 1 White Carnation with long stem - Water - Food Coloring (Whatever colors you wish, we chose red and blue) - Scissors
Methods:
Fill both of the cups with water and add about four or five drops of food coloring in to each of the cups. tablespoons of salt to one of the dishes. Using the scissors have a parent cut stem of the flower in half along the length of the flower until about half way up the stem.
Pasted Graphic 1 Now place each side of the stem into one of the cups


flower in water


Let the flower sit in the water for around 48 hours


After a few days you should clearly be able to see a color change in your flower. In the picture above you can see the top right part is nice and red while the bottom left of our flower in blue. This is the result of different parts of the stem up taking the different colors of water. You can experiment with all sorts of of food colors to make whatever color flower you wish.


Osmosis in Potatoes

http://herbarium.desu.edu/pfk/page17/page18/page19/page19.html

The following experiment is a fun and easy way to see the effects of plant osmosis on a plant by comparing two different potatoes placed in different types of water
These are the materials needed to view osmosis in action:

- 2 Potatoes - 2 Plates - Salt - Water - Knife
Methods:
Fill both of the dishes with water and add about two tablespoons of salt to one of the dishes. Using the knife have a parent cut the potato in half lengthwise. Then Place each piece flat side down in to one of the plates of water.
Pasted Graphic 1


Now simply let the two potato pieces soak in the water for a few hours. After this time has passed flip each potato over and look for differences.


When looking at the potato pieces you can clearly see a difference between the two. Lets take a closer look at each of the potato pieces! Pasted Graphic 5

This potato slice is the one that has been soaking in freshwater. Not much of a difference here, only that the potato is a little more rigid then before. This is because there is the more salt and other dissolved chemicals within the potato then the surrounding water. This means that the water will move into the potato.

Pasted Graphic 3

This potato slice is the one that has been soaking in saltwater. This potato pieces looks substantially different from the original and the other slice. It seems to have wilted, gotten very soft and flexible. Why did that happen?

It has to do with a process called osmosis. The potato is made up of tiny, living units called cells. Each cell is surrounded by a cell membrane which acts much as your skin does. It keeps the cells parts inside and keeps other things outside, protecting the cell.

While this membrane stops most things, water can pass through it. The water tends to move towards higher concentrations of dissolved chemicals. That means that if the water outside the cell is saltier than the water inside, water will move from the inside of the cell to the outside. As the water left the cell it was much like letting the air out of a balloon. As more and more of the cells lost water, the slice of potato became soft and flexible.

Plant from Cut Leaf

DSCN0555Plants For Kids

Bringing the science of plants to the classroom

 The following experiment is a fun and easy way to see the effects of plant hormones on a plant by growing an new plant from a simple leaf cutting
These are the materials needed to grow your own plant:

-African violet leaf* -Bottle or jar -Aluminum foil -Water-soluble plant fertilizer (an general fertilizer will do, we used 20-20-20) -Water -Knife *Other plants can be used like: Peperomia, and Christmas cactus (Schlumbergera bridgesii)


Methods:
DSCN0528
Take a pinch of fertilizer and put in the bottle or jar you are using.
Be sure not to touch fertilizer with your hands, use a spoon!


Fill the container with water.

Fit a small piece of aluminum foil over the top of the container

DSCN0539 copy Make a small hole where the leaf will fit in.
DSCN0537 copy
 Now take a sharp knife and cut a leaf close to the stem.


Stick the leaf in the hole that you made in the aluminum foil.

Make sure that just the cut tip of the leaf is submerged in the water and be sure to maintain the water level so that the leaf tip is always submerged.

Roots will begin to grow in about 3 weeks from the tip of the cut leaf

DSCN0503


DSCN0545
The leaf and roots are now ready plant in a pot of their own!!!!

 http://herbarium.desu.edu/pfk/page14/page15/page16/page16.html

Shoe-box Maze

The following experiment is a fun and easy way to see the effects of phototropism on a plant by making it complete your own maze
These are the materials needed to make your own shoe-box maze:

DSCN0434 copy
 -Shoebox -Extra cardboard -Scissors -Tape -Small potted plant (bean plant)


 Methods:
  Cut a large hole at one end of the shoebox. Hold the box up to the light and be sure to tape up any other spaces where light shines through.

Cut two pieces of cardboard in the following sizes:
First make both pieces half the width of the shoebox.
Then make both pieces the same height of the shoebox.

Now divide the box in thirds and tape one cut cardboard piece on the left side of the box at the one-third mark. Next, tape the other cardboard piece on the right side of the box at the two-thirds mark.

Place the small potted plant in the shoebox opposite the hole, make sure that it is well watered. (We started a bean in a plastic cup.)                                                                                                                                                  
                                                                                                             
 
Close the box, tape it, and place it in a sunny window.


DSCN0561 copyIn about 4 or 5 days open the box and notice how the plant
grows in the direction of the light coming from the hole!!!

DSCN0440


http://herbarium.desu.edu/pfk/page11/page12/page13/page13.htm

Upside Down Bean Experiment

The following experiment is a fun and easy way to see the effects of gravitropism on a plant.
 Plants For Kids

Bringing the science of plants to the classroom

 http://herbarium.desu.edu/pfk/page8/page9/page10/page10.html

These are the materials needed to make your own upside down plant: 

-Two sponges -Small bean plant -String -Scissors -Water -Thumbtack 

Methods:    
Pour water over sponges until they are moist.

DSCN0451 copyDSCN0449 copy
Take small potted plant out of pot and remove much of the soil. (We used a small bean plant that we planted in a plastic cup.)

Sandwich the roots between the sponges.
       
DSCN0460 copy

DSCN0454 copy Tie the string around the sponges lengthwise and widthwise. Then hang 
the plant upside down in a sunny 
window with a tray under it to
 catch excess water.


Keep the sponges watered and in a couple of days the plant will begin to turn around and grow upright!!


Hairy Caterpillar


The following experiment is a fun and easy way to see the effects of germination and the quick growth of grass

Plants For Kids

Bringing the science of plants to the classroom.

 http://herbarium.desu.edu/pfk/page1/page2/page3/page3.html

 These are the materials needed for the creation of your very own caterpillar:
-All purpose potting soil
-Nylon stocking
-Any quick growing grass seed
-Spoon
DSCN0121
-Large bowl
-Paper cup (or any small container that you can cut with scissors)
-Colorful elastic pony tail holders or colored rubber bands
-Pipe cleaner
-Two trash bag ties
-Glue
-Scissors
-Large google eyes (2)
-Small pom poms (2)
-Plastic bag
-Plate or shallow tray
-Water 


 Methods:
In a large bowl, mix about 4 cups of soilwith 4 spoons of grass seed

Cut the bottom out of a paper cup or small container to create a funnel

 Pour a little less than a cup of the soil/seed mixture into the stocking

Slide a ponytail holder or rubber band over the end of the stocking to section it off a portion of soil. 

 Repeat until you have 5 colorful caterpillar segments. ie the end of the stocking into a knot and cut off any extra nylon remaining (this will be the nose). 

 Soak the caterpillar in water for 10 minutes then allow to sit in a plastic bag overnight 

 Remove the bag. To create the eyes stick two trash bag ties in the front of the stocking above the nose. Glue one google eye on the end of each trash tie. 

To create the antennae, cut one pipe cleaner in half and glue one pom pom on the end of each half (or curl the pipe cleaner into a crazy shape). Stick each antenna into the stocking behind the eyes of the caterpillar. You can also use the pipe cleaners as legs for your caterpillar. 

Place your caterpillar on a plate or tray near a sunny window and water thoroughly every other day. 

 In 4 to 5 days your caterpillar will begin to grow “hair”!


Thursday, October 16, 2014

Leaf Litter Experiment


Collecting Leaf Litter from Nature
Materials you will need:
• Bucket or Plastic Bag
• Small Shovel
• Hand Magnifying Glass
• Paint Brushes
• Small Shallow Pot (petri dish) with lid
• Large container (white washing bowl)
• A Pooter
• Garden gloves

What is life and its complex food chain???

 
 STEPS

1.  Find an area where you can collect a good sample of layers of leaves and soil.

2.  Observe the area around this spot and take note of the life around it.

3.  Collect several scoops of leaves and the soil to put in your bucket or bag.

4.  Take your sample to an area to work in.

5.  Empty your contents of leaf litter on or in a contained surface/area so that you can spread it around to get a good look at all the contents within.

6.  Use a paint brush to move around and sweep through the leaf litter.

7.  Can you see anything moving?  If so collect the insects with a scoop, the paint brush or pooter and put them in your small container or Petri dish and examine it with your magnifying lens.

8.  Make notes of what you can detect from the leaf litter.  Can you identify any of the insects collected?

9.  Collect leaf litter from a completely different area and compare your findings.  Maybe you collected from under a tree so you may want to compare these insects with what you may find from an entirely different surrounding.                             
                          
Ask yourself these questions?
1.  Did you find anything that was alive and moving?
2.  Did you find anything that was no longer alive?
3.  What insects did you find in your leaf litter?
4.  Would you consider leaf litter to be part of the food chain?
5.  Do the non-living insects and microbial life serve any purpose?
From leaf litter you could possibly find:   (Within the ecological food chain, consumers are categorized into three groups within an ecological food chain).
Primary consumers  - are usually herbivores, feeding on plants and fungus.
Secondary consumers - are mainly carnivorous and prey on other animals.
Tertiary consumers - are carnivore at the topmost level that feed on other carnivores.  They feed on secondary consumers and primary consumers.  In this experiment we are looking for spiders..
Did you know...
~Leaf litter is food and shelter for insects and microbial life.
~The composition of leaf litter contains living and non-living parts.
~Leaf litter and soil litter help to maintain soil fertility and structure.
~ Nutrients locked up in dead organic matter are released through a complex food chain.
BE SURE TO WASH YOU HAND AFTER DOING YOUR EXPERIMENT

The future of food

http://video.nationalgeographic.com/video/141016-world-food-day-ngfood?source=food

Thursday, October 9, 2014

How to write a scientific paper


Almost Everything You Wanted to Know About
Making Tables and Figures

Once your statistical analyses are complete, you will need to summarize the data and results for
presentation to your readers. Data summaries may take one of 3 forms: text, Tables and Figures.
Text: contrary to what you may have heard, not all analyses or results warrant a Table or
Figure. Some simple results are best stated in a single sentence, with data summarized
parenthetically:
“Seed production was higher for plants in the full-sun treatment (52.3 +/-6.8 seeds)
than for those receiving filtered light (14.7 ± 3.2 seeds, t=11.8, df=55, p<0.001.)”
Tables: Tables present lists of numbers or text in columns, each column having a title or label.
Do not use a table when you wish to show a trend or a pattern of relationship between sets of
values - these are better presented in a Figure.

Figures: Figures are visual presentations of results, including graphs, diagrams, photos,
drawings, schematics, maps, etc. Graphs are the most common type of figure and will be
discussed in detail; examples of other types of figures are included at the end of this section.
Graphs show trends or patterns of relationship.

How to Cite Other Sources in Your Paper

Throughout the body of your paper, whenever you refer to outside sources of information, you must cite the sources from which you drew information. The simplest way to do this is to parenthetically give the author's last name and the year of publication, e.g., (Clarke 2001).
  • Typically, only the last name of the author(s) and the year of publication are given,e.g., Bugjuice 1970. Your Literature Cited section will contain the complete reference, and the reader can look it up there.
  • Notice that the reference to the book has a page number (Gumwad 1952:209). This is to facilitate a reader's finding the reference in a long publication such as a book (not done for journal articles). The paper by Bugjuice (1970) is short, and if readers want to find the referenced information, they would not have as much trouble.
  • For two author papers, give both authors' last names (e.g., Click and Clack 1974). Articles with more than two authors are cited by the first authors last name followed "and others" or "et al.", and then the year.
  • When a book, paper, or article has no identifiable author, cite it as Anon. Year, e.g., (Anon. 1996) (Anon. is the abbreviation for anonymous). See Full Citation.
  • If you want reference a paper found in another article, do so as follows: (Driblick 1923, in Oobleck 1978).
  • A string of citations should be separated by semicolons, e.g., (Gumwad 1952:209; Bugjuice 1970; Bruhahauser et al 1973).
  • Finally, you should note the placement of the period AFTER the parenthetical citation - the citation, too, is part of a sentence,e.g., "...courtship behavior (Gumwad 1952:209; Bugjuice 1970)."
Thesis: Theses and dissertations should be cited as follows:
Mortimer, R. 1975. A study of hormonal regulation of body temperature and consequences for reproductive success in the common house mouse (Mus musculus) in Nome, Alaska. Masters Thesis, University of Alaska, Anchorage. 83 p.
World Wide Web/Internet source citations: WWW citation should be done with caution since so much is posted without peer review. When necessary, report the complete URL in the text including the site author's name:
 Internet sources should be included in your Literature Cited section.
Some basic rules applicable to all formats indexed by author name(s):
  • All citation entries are listed in alphabetical order based the first author's last name;
  • If the same author(s) are cited for more than one paper having the same order of authors' names, the papers should be listed in chronological sequence by year of publication.
  • Authors' names MUST be listed in the citation in the same order as in the article.
Bugjuice, B., Timm, T. and R. Cratchet. 1990. The role of estrogen in mouse
xxxxcourtship behavior changes as mice age. J Physiol 62(6):1130-1142.
Cratchet, R., Bugjuice, B.and T. Timm. 1994. Estrogen, schmestrogen!: Mouse
xxxx(Mus musculus) as a dietary alternative for humans. J Nutrition 33(6):113 -114.
Bugjuice, B. 1970b. Physiological effects of estrogen analogs: Insincere courtship
xxxxbehavior in female mice. J Physiol 40(8):1240-1247.