http://www.earthday.org/footprint-calculator?key=0
http://www.footprintnetwork.org/en/index.php/GFN/page/calculators/
What is the Ecological Footprint?
The Ecological Footprint
is a resource accounting tool that measures how much biologically
productive land and sea is used by a given population or activity, and
compares this to how much land and sea is available. Productive land and
sea areas support human demands for food, fiber, timber, energy, and
space for infrastructure. These areas also absorb the waste products
from the human economy. The Ecological Footprint measures the sum of
these areas, wherever they physically occur on the planet. The
Ecological Footprint is used widely as a management and communication
tool by governments, businesses, educational institutions, and
non-governmental organizations.
Personal footprint: http://www.footprintnetwork.org/en/index.php/GFN/page/personal_footprint/
Saturday, March 28, 2015
DARWIN'S NIGTHMARE
A documentary on the effect of fishing the Nile perch in Tanzania's Lake
Victoria. The predatory fish, which has wiped out the native species,
is sold in European supermarkets, while starving Tanzanian families have
to make do with the leftovers.
FORESTS
Forest Loss
If the net forest loss of all territories between 1990 and 2000 is summed, 31% occurred in South America, and 21% was in Asia Pacific. Worldwide, territories with net forest loss lost 1.33 million km2 of forest over this ten year period. Despite this, South America was the region with the largest forested area in the world in 2000. The more forest area there is, the more it is possible to lose.
Japan is unexceptional, having neither forest loss nor forest growth from 1990 to 2000.
The area of Africa covered by forest was reduced by 550 000 km2 in the 1990s. This includes the loss of forests that covered 11.4% of Zambian land.
Traditional Fuel
Traditional fuel includes wood, charcoal, bagasse (sugar cane waste), and animal and vegetable wastes. This fuel can be waste material from another process. It is usually sourced locally and sometimes can be free. Thus it is not surprising that people living in Central Africa have the highest per person traditional fuel usage, given the poor infrastructures there and relatively weak economic position.
Ironically Equatorial Guinea, where the most traditional fuel (per person) is used, exports considerable quantities of oil. The Middle East, source of most of the earth’s oil, uses the traditional fuel equivalent of only 77 kilograms of oil per person.
WATER
http://www.worldmapper.org/display.php?selected=102
WATER RESOURCES
Water resources here include only freshwater, because saline (sea) water requires treatment before most uses. Only 43 600 cubic kilometres of freshwater is available as a resource each year, despite more than twice this amount falling as precipitation (rain and snow). Much is lost through evaporation. Those countries with higher rainfall often have larger water resources. Of all the water available, the regions of South America and Asia Pacific have the most.
People living in Kuwait use sea water that is processed at a desalination plant. As such Kuwait has no area on this map because there are no freshwater resources there.
WORLD WATER RESOURCE DISTRIBUTION
Central Africa 4%
Southeastern Africa 2%
Northern Africa 3%
Southern Asia 4%
Asia Pacific 17%
Middle East 11%
Eastern Asia 7%
South America 30%
Eastern Europe 2%
North America 15%
Western Europe 4%
Japan 1%
Groundwater is water that has infiltrated rocks, and moved deep into the ground. Groundwater usually travels through permeable rocks, and sometimes forms underground rivers. Nearly 70% of all freshwater is groundwater, making it an important water source.Groundwater recharge is when the water stored below ground is replenished. Each year 11 400 cubic kilometres of surface freshwater becomes groundwater. In many places this is not enough to replenish water being withdrawn.
Regionally South America has the most groundwater recharge. The lowest is in Japan.
WORLD GROUNDWATER RECHARGE
Central Africa 8%
Southeastern Africa 2%
Northern Africa 4%
South Asia 5%
Asia Pacific 10%
Middle East 8%
East Asia 8%
South America 34%
Eastern Europe 2%
North America 16% Western Europe 4%
Japan 0.24%
Four thousand cubic kilometres of water are used by people each year around the world, for domestic, agricultural and other industrial purposes. This does not include non-consumptive uses such as energy generation, mining, and recreation.
China, India and the United States use the most water. These are also the territories where the most people live. But water use per person is about three times higher in the United States than it is in India and China.
Whilst everybody needs water, people use hugely varying quantities. On average, people living in Central Africa each use only 2% of the water used by each person living in North America.
WORLD WATER USE
Central Africa 0.076%
Southeastern Africa 1%
Northern Africa 4%
Southern Asia 24%
Asia Pacific 9%
Middle East 11%
Eastern Asia 17%
South America 5%
Eastern Europe 4%
North America 16%
Western Europe 6%
Japan 2%
Water for domestic purposes includes drinking water, use for public services, commercial service establishments (such as hotels), and homes. 325 billion cubic metres of water are so used worldwide each year. The world average water use per person is 52 cubic metres per year.
There is huge variation in water use per person. Between 1987 and 2003 people living in Cambodia, where the majority do not have access to improved water supplies, used an average of 1.8 cubic metres of water each. People in Costa Rica used one hundred times more. The residents of Australia on average each use another 300 cubic metres again per year - much to water their lawns and fill pools.
"I remember when I was 14, carrying a 20 litre water can on my head, filling it from a river some thirty minutes away. When I came to Canada, I was shocked by the extravagant use of water here." Sieru Efrem, 2003
WATER RESOURCES
Water resources here include only freshwater, because saline (sea) water requires treatment before most uses. Only 43 600 cubic kilometres of freshwater is available as a resource each year, despite more than twice this amount falling as precipitation (rain and snow). Much is lost through evaporation. Those countries with higher rainfall often have larger water resources. Of all the water available, the regions of South America and Asia Pacific have the most.
People living in Kuwait use sea water that is processed at a desalination plant. As such Kuwait has no area on this map because there are no freshwater resources there.
WORLD WATER RESOURCE DISTRIBUTION
Central Africa 4%
Southeastern Africa 2%
Northern Africa 3%
Southern Asia 4%
Asia Pacific 17%
Middle East 11%
Eastern Asia 7%
South America 30%
Eastern Europe 2%
North America 15%
Western Europe 4%
Japan 1%
Groundwater Recharge
Groundwater is water that has infiltrated rocks, and moved deep into the ground. Groundwater usually travels through permeable rocks, and sometimes forms underground rivers. Nearly 70% of all freshwater is groundwater, making it an important water source.Groundwater recharge is when the water stored below ground is replenished. Each year 11 400 cubic kilometres of surface freshwater becomes groundwater. In many places this is not enough to replenish water being withdrawn.
Regionally South America has the most groundwater recharge. The lowest is in Japan.
WORLD GROUNDWATER RECHARGE
Central Africa 8%
Southeastern Africa 2%
Northern Africa 4%
South Asia 5%
Asia Pacific 10%
Middle East 8%
East Asia 8%
South America 34%
Eastern Europe 2%
North America 16% Western Europe 4%
Japan 0.24%
Water Use
Four thousand cubic kilometres of water are used by people each year around the world, for domestic, agricultural and other industrial purposes. This does not include non-consumptive uses such as energy generation, mining, and recreation.
China, India and the United States use the most water. These are also the territories where the most people live. But water use per person is about three times higher in the United States than it is in India and China.
Whilst everybody needs water, people use hugely varying quantities. On average, people living in Central Africa each use only 2% of the water used by each person living in North America.
WORLD WATER USE
Central Africa 0.076%
Southeastern Africa 1%
Northern Africa 4%
Southern Asia 24%
Asia Pacific 9%
Middle East 11%
Eastern Asia 17%
South America 5%
Eastern Europe 4%
North America 16%
Western Europe 6%
Japan 2%
Domestic Water Use
Water for domestic purposes includes drinking water, use for public services, commercial service establishments (such as hotels), and homes. 325 billion cubic metres of water are so used worldwide each year. The world average water use per person is 52 cubic metres per year.
There is huge variation in water use per person. Between 1987 and 2003 people living in Cambodia, where the majority do not have access to improved water supplies, used an average of 1.8 cubic metres of water each. People in Costa Rica used one hundred times more. The residents of Australia on average each use another 300 cubic metres again per year - much to water their lawns and fill pools.
"I remember when I was 14, carrying a 20 litre water can on my head, filling it from a river some thirty minutes away. When I came to Canada, I was shocked by the extravagant use of water here." Sieru Efrem, 2003
Ilha Das Flores, Island of Flowers
-
The ironic, heartbreaking and acid "saga" of a spoiled tomato: from the plantation of a "Nisei" (Brazilian with Japanese origins); to a supermarket; to a consumer's kitchen to become sauce of a pork meat; to the garbage can since it is spoiled for the consumption; to a garbage truck to be dumped in a garbage dump in "Ilha das Flores"; to the selection of nutriment for pigs by the employees of a pigs breeder; to become food for poor Brazilian people.- Written by Claudio Carvalho, Rio de Janeiro, Brazil
Monday, March 16, 2015
Light Affecting Plant Growth
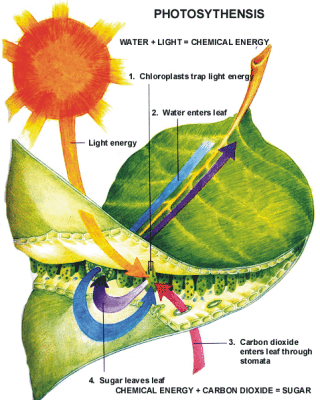
Aside from water and nutrients, light is most essential when growing and flourishing a plant. The amount of light received for the plant can ulitimately determine the length and time alive consisting for the plant itself. Light is necessary for all plants because they use this energy source to photosynthesize, and can easily die off if absent for an extended amount of time from light.[1] Photosynthesis mainly permits plants to combine glucose from water and carbon dioxide while releasing oxygen. A plants chloroplasts simply trap light energy where the water can then enter into the leaf and then become chemical energy. [2] Plants require light energy for the process of Photosynthesis by which they convert this light energy to chemical energy.With the presence of chlorophyll in plants, they have the ability to absorb light emitted from the sun. Chlorophyll appears green in color and absorbs red and blue light. The red light has the important role of flower growth when combined with blue light, where blue light is responsible for vegetative growth.FUN FACT: Chlorophyll is unable to absorb green light, therefore with the inability makes the leaves of plants and chlorophyll appear green to the human eye!
Sunlight also comes into play with plant growth with 'Phototropisms'. Phototropism is a plants reaction to light. The cause of phototropism is an auxin. Auxin is a hormone which explains the side of the plant with the most shade to grow longer than the other side, which then results in a plant to bend toward the light source.[3] Without light, plants reduce their ability to develope and reproduce as much as they naturally can. Without light, photosynthesis would not take place.
Photosynthesis and light.
Photosynthesis
is the process in which light energy is converted into chemical energy.
Using the energy of light, carbohydrates such as sugars are synthesised
from carbon dioxide and water.
The name photosynthesis is derived from the Greek words, photo for ‘light’ and synthesis
meaning ‘putting together’. Oxygen is also released, as a waste
product. Light is the major factor for photosynthesis to take place and
by doing this experiment we need to prove that light is necessary for
photosynthesis.
The Process of Photosynthesis
The process of photosynthesis occurs when green plants use the energy of light to convert carbon dioxide (CO2) and water (H2O)
into carbohydrates. Light energy is absorbed by chlorophyll, a
photosynthetic pigment of the plant, while air containing carbon dioxide
and oxygen enters the plant through the leaf stomata. An extremely
important by-product of photosynthesis is oxygen, on which most
organisms depend.
Glucose, a carbohydrate processed during
photosynthesis, is mostly used by plants as an energy source to build
leaves, flowers, fruits, and seeds. Molecules of glucose later combine
with each other to form more complex carbohydrates such as starch and
cellulose. The cellulose is the structural material used in plant cell
walls. Photosynthesis provides the basic energy source for virtually all
organisms.
We can express the overall reaction of photosynthesis as:
Where does Photosynthesis occur?
Photosynthesis takes place primarily in
leaves and little to none occurs in stems. It takes place within
specialised cell structures called chloroplasts. A leaf has a petiole or
the stalk and a lamina, the flat portion of the leaf. As its area is
broad, the lamina helps in the absorption of sunlight and carbon dioxide
during photosynthesis. Photosynthesis takes place in the chloroplasts
that have chlorophyll present in them. It is the chlorophyll that
absorbs light energy from the sun. There are tiny pores called stomata
that function as roadways for carbon dioxide to enter and oxygen to
leave the plant.
Role of the colour of light during Photosynthesis
Did you know that the colour of light plays
an important role during photosynthesis? Yes, it does. Plants use only
certain colours from light for the process of photosynthesis. The
chlorophyll absorbs blue, red and violet light rays. Photosynthesis
occurs more in blue and red light rays and less, or not at all, in green
light rays.
The light that is absorbed the best is
blue, so this shows the highest rate of photosynthesis, after which
comes red light. Green light cannot be absorbed by the plant, and thus
cannot be used for photosynthesis. Chlorophyll looks green because it
absorbs red and blue light, making these colours unavailable to be seen
by our eyes. It is the green light which is not absorbed that finally
reaches our eyes, making the chlorophyll appear green
The spectrum
http://www.botany.uwc.ac.za/ecotree/photosynthesis/spectrum.htm#middle
Electromagnetic radiation spans a broad range of wavelengths. At the one end of
the spectrum of electromagnetic radiation there are gamma rays which have a
wavelength of 10-5 nm and at the
other end, radio waves which have a wavelength of 1012nm. A
very small part of this spectrum can be seen by the human eye i.e. between the wavelengths
380 and 750 nm. This part of the electromagnetic spectrum is called visible light. Almost all life depends ultimately
on this part of the spectrum for its energy. Humans perceive the different wavelengths
of visible light as different colours.
Within the spectrum the longer the wavelength of the radiation, the slower the vibration of the photons and the less energy each photon contains. Thus photons of ultraviolet light, at the blue end of the visible spectrum, have shorter wavelengths and contain more energy than red light and infrared radiation.
Sunlight contains 4% ultraviolet radiation, 52% infrared radiation and 44% visible light.
Why is only visible light used by plants ?
The nature of light
The energy produced by the sun reaches the earth as electromagnetic radiation. Light and other forms of electromagnetic radiation are considered to have both a wave nature and a particle nature. Particles or packets of light (its particle nature) are known as photons - the smallest divisible units of light. The brightness of light depends on the number of photons absorbed per unit time. Each photon carries a fixed amount of energy which determines the amount that the photon vibrates. The distance moved by a photon during one of it vibrations is referred to as its wavelength and is measured in nanometres.Within the spectrum the longer the wavelength of the radiation, the slower the vibration of the photons and the less energy each photon contains. Thus photons of ultraviolet light, at the blue end of the visible spectrum, have shorter wavelengths and contain more energy than red light and infrared radiation.
Sunlight contains 4% ultraviolet radiation, 52% infrared radiation and 44% visible light.
Why is only visible light used by plants ?
Light and photosynthesis.
Chlorophyll does not absorb all the wavelengths of visible light equally. Chlorophyll a, the most important light-absorbing pigment in plants, does not absorb light in the green part of the spectrum. Light in this range of wavelengths is reflected. This is the reason why chlorophyll is green and also why plants (which contain a lot of chlorophyll) are also green. Note in the graph above that the absorption of light by chlorophyll a is at a maximum at two points on the graph 430 and 662 nm. The rate of photosynthesis at the different wavelengths of visible light also show two peaks which roughly correspond to the absorption peaks of chlorophyll a. Plants do not depend only on chlorophyll a in their light harvesting machinery but also have other pigments (accessory pigments) which absorb light of different wavelengths.Sunday, March 15, 2015
Staying healthy.
Staying healthy:
http://www.bbc.co.uk/schools/gcsebitesize/scienc/ocr_gateway/understanding_organisms/staying_healthyrev1.shtml
Animation:http://www.bbc.co.uk/schools/gcsebitesize/science/ocr_gateway/understanding_organisms/staying_healthyact.shtml
Blood pressure animation:
http://www.bbc.co.uk/schools/gcsebitesize/science/ocr_gateway/understanding_organisms/fitness_healthact.shtml
Diet and exercise:
http://www.bbc.co.uk/schools/gcsebitesize/science/ocr_gateway/understanding_organisms/dietact.shtml
Staying in balance:
http://www.bbc.co.uk/schools/gcsebitesize/science/ocr_gateway/understanding_organisms/staying_in_balanceact.shtml
Medical trials.
http://www.bbc.co.uk/schools/gcsebitesize/science/aqa/drugs_use/drugsrev1.shtmlDrugs are substances that change chemical reactions in the body. Medical
drugs relieve disease and illness, and are extensively tested before
being used. Recreational drugs such as alcohol and tobacco are taken by
people because they like the effects they have on their bodies, but they
may be addictive. Cannabis and heroin are illegal recreational drugs
that are very addictive.
Tuesday, March 10, 2015
The Flu in Context: Epidemics, Vaccines and Prevention.
http://www.educationworld.com/a_lesson/flu-epidemics-vaccines-science.shtml
Younger students can use this worksheet to stimulate thinking about contagious illnesses in schools and what can be done to prevent their spread.
Older students can access information on both vaccines and health precautions on the CDC site’s 2013 flu information page. In subsequent years, the information can be found on the CDC site.
Use the EducationWorld lesson News for You: Kids Can Lower Their Flu Risk to build media skills and teach about prevention.
Check Student Understanding:
Assessment
Evaluate students using the 17 “Check Student Understanding” questions that appear throughout this lesson.
Submitted By
Jason Tomaszewski, EducationWorld Associate Editor
- See more at: http://www.educationworld.com/a_lesson/flu-epidemics-vaccines-science.shtml#sthash.pihQzTKF.dpuf
Other health precautions include limiting contact with sick people, hand washing, using hand sanitizer, covering coughs and sneezes and taking antiviral medications.
Younger students can use this worksheet to stimulate thinking about contagious illnesses in schools and what can be done to prevent their spread.
Older students can access information on both vaccines and health precautions on the CDC site’s 2013 flu information page. In subsequent years, the information can be found on the CDC site.
Use the EducationWorld lesson News for You: Kids Can Lower Their Flu Risk to build media skills and teach about prevention.
Check Student Understanding:
Assessment
Evaluate students using the 17 “Check Student Understanding” questions that appear throughout this lesson.
Submitted By
Jason Tomaszewski, EducationWorld Associate Editor
- See more at: http://www.educationworld.com/a_lesson/flu-epidemics-vaccines-science.shtml#sthash.pihQzTKF.dpuf
http://www.educationworld.com/a_lesson/flu-epidemics-vaccines-science.shtmlAt
certain points in history, many people have become infected with a
particular illness. For example, the Black Death ravaged Europe from the
year 1347 to the early 1350s, killing almost one-third of the
continent’s population.
When a large number of people become seriously ill due to the same bacteria or virus, it is called an epidemic—or, if the disease spreads globally, a pandemic. Help students put modern influenza outbreaks into perspective by comparing them with other epidemics and pandemics. Then, discuss how vaccines and other precautions work to reduce the likelihood of illness.
Begin with some basic terms and explanation:
1. Bacteria and viruses
Bacteria are microscopic one-celled organisms. Thousands of types of bacteria live almost everywhere. Bacteria can reproduce themselves (multiply). Some bacteria are helpful, while others can make us sick.
Viruses, another major cause of illness, are smaller than bacteria and may have a spiny outside layer. Viruses can’t reproduce on their own, so they infect cells and take them over in order to multiply.
Here is a basic exploration of the concepts of bacteria and viruses. Older students can check out a detailed example using this image of the flu virus.
Check Student Understanding:
2. Epidemic vs. pandemic
While disease has affected humans since the beginning of time, it wasn’t until people began gathering in larger populations that infections began to reach epidemic levels. An epidemic happens when an infection (caused by a bacteria or virus) affects a large number of people within a given population, such as a city or geographic area. If it affects even greater numbers and a wider area, these outbreaks become pandemics.
The video below discusses how pandemics spread:
- See more at: http://www.educationworld.com/a_lesson/flu-epidemics-vaccines-science.shtml#sthash.pihQzTKF.dpuf
When a large number of people become seriously ill due to the same bacteria or virus, it is called an epidemic—or, if the disease spreads globally, a pandemic. Help students put modern influenza outbreaks into perspective by comparing them with other epidemics and pandemics. Then, discuss how vaccines and other precautions work to reduce the likelihood of illness.
Begin with some basic terms and explanation:
1. Bacteria and viruses
Bacteria are microscopic one-celled organisms. Thousands of types of bacteria live almost everywhere. Bacteria can reproduce themselves (multiply). Some bacteria are helpful, while others can make us sick.
Viruses, another major cause of illness, are smaller than bacteria and may have a spiny outside layer. Viruses can’t reproduce on their own, so they infect cells and take them over in order to multiply.
Here is a basic exploration of the concepts of bacteria and viruses. Older students can check out a detailed example using this image of the flu virus.
Check Student Understanding:
- What are bacteria?
- What are viruses?
- What are some differences between bacteria and viruses?
- Describe some of the flu virus’ internal structures.
2. Epidemic vs. pandemic
While disease has affected humans since the beginning of time, it wasn’t until people began gathering in larger populations that infections began to reach epidemic levels. An epidemic happens when an infection (caused by a bacteria or virus) affects a large number of people within a given population, such as a city or geographic area. If it affects even greater numbers and a wider area, these outbreaks become pandemics.
The video below discusses how pandemics spread:
- See more at: http://www.educationworld.com/a_lesson/flu-epidemics-vaccines-science.shtml#sthash.pihQzTKF.dpuf
Younger students can use this worksheet to stimulate thinking about contagious illnesses in schools and what can be done to prevent their spread.
Older students can access information on both vaccines and health precautions on the CDC site’s 2013 flu information page. In subsequent years, the information can be found on the CDC site.
Use the EducationWorld lesson News for You: Kids Can Lower Their Flu Risk to build media skills and teach about prevention.
Check Student Understanding:
- What is the flu?
- What causes the flu?
- Describe flu symptoms.
- How does the flu spread?
- How is this year’s flu similar to, or different from, the flu of years past?
- How can the flu be prevented?
Assessment
Evaluate students using the 17 “Check Student Understanding” questions that appear throughout this lesson.
Submitted By
Jason Tomaszewski, EducationWorld Associate Editor
- See more at: http://www.educationworld.com/a_lesson/flu-epidemics-vaccines-science.shtml#sthash.pihQzTKF.dpuf
Other health precautions include limiting contact with sick people, hand washing, using hand sanitizer, covering coughs and sneezes and taking antiviral medications.
Younger students can use this worksheet to stimulate thinking about contagious illnesses in schools and what can be done to prevent their spread.
Older students can access information on both vaccines and health precautions on the CDC site’s 2013 flu information page. In subsequent years, the information can be found on the CDC site.
Use the EducationWorld lesson News for You: Kids Can Lower Their Flu Risk to build media skills and teach about prevention.
Check Student Understanding:
- What is the flu?
- What causes the flu?
- Describe flu symptoms.
- How does the flu spread?
- How is this year’s flu similar to, or different from, the flu of years past?
- How can the flu be prevented?
Assessment
Evaluate students using the 17 “Check Student Understanding” questions that appear throughout this lesson.
Submitted By
Jason Tomaszewski, EducationWorld Associate Editor
- See more at: http://www.educationworld.com/a_lesson/flu-epidemics-vaccines-science.shtml#sthash.pihQzTKF.dpuf
SUPERBUGS
http://www.dailymail.co.uk/health/article-2869706/Superbugs-kill-10-MILLION-people-year-2050-cost-world-economy-100-TRILLION-unless-urgent-action-taken-tackle-growing-resistance-antibiotics.html#v-3936379863001
http://www.cbsnews.com/news/superbug-warning-drug-resistant-infections-could-kill-10-million-a-year/
Subscribe to:
Posts (Atom)